Using the Indigo Web Interface

![]()
Introduction
With the release of indigo-1.0-web in February 2011, a web interface has been added to the Indigo software package. This interface provides the ability to monitor and control the OpenFlow switch directly from a web browser.
The Web Pages
Common Parts of Indigo Web Pages
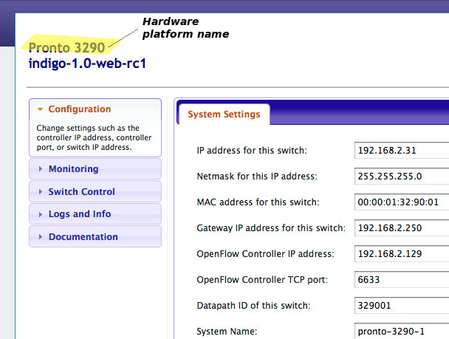
Hardware Platform Name
|
In the upper left corner of the web page you'll find the name of the hardware platform. |
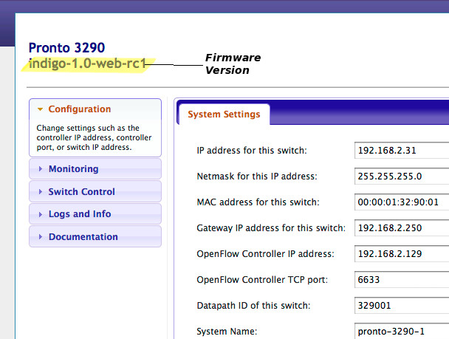
Firmware Version
|
Below the name of the hardware is the firmware release name. For non-official releases, the build time and short description will be given. |
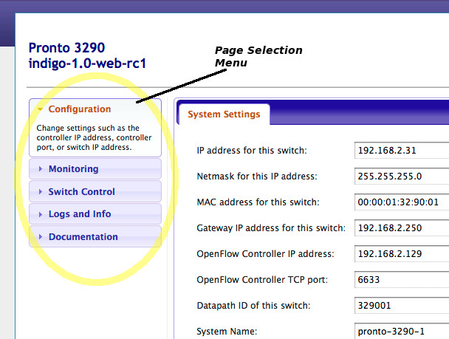
The Page Selection Menu
|
On the left side of the page is a menu with the list of available pages. The current page selected will have a short description displayed. |
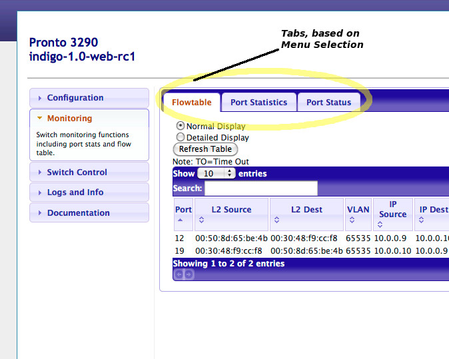
The Tab Menu
|
Once a main page has been selected, a list of tabs is shown on the upper part of the main page. This acts as a submenu relative to the main menu selection. |
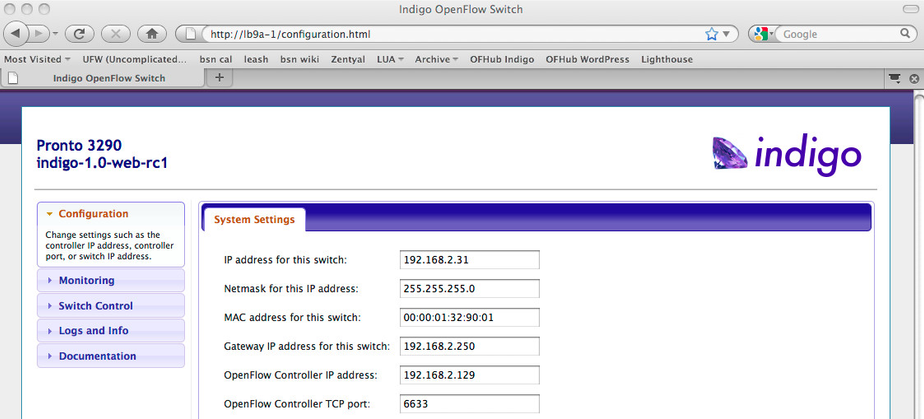
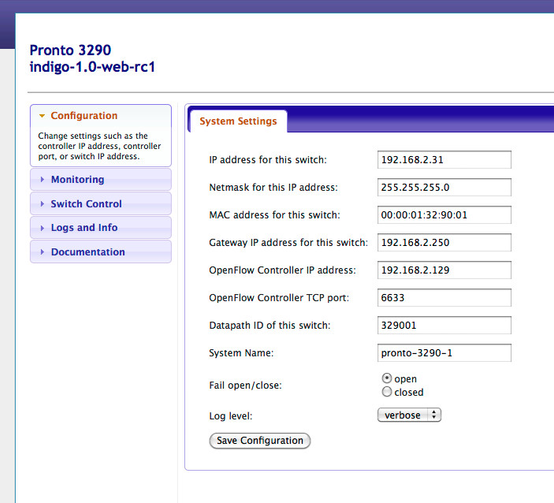
The Configuration Page
|
The configuration page provides only one tab, System Settings. The form on this page allows the configuration of various settings. The most important entries are the IP address of the switch and the IP address and port number of the controller. |
The Monitoring Page
|
The monitoring page allows you to monitor the current flow table, port statistics and port link settings. |

Note that the flow table display allows you to view a summary of information for each flow or the full details of each flow. |
Switch Control
|
The switch control page includes tabs for uploading a new image, rebooting the system and restarting OpenFlow related processes. The LB4G/3240 also has a link to burn an image into flash memory. On the LB9A/3290, the image is loaded directly to the CF card. |
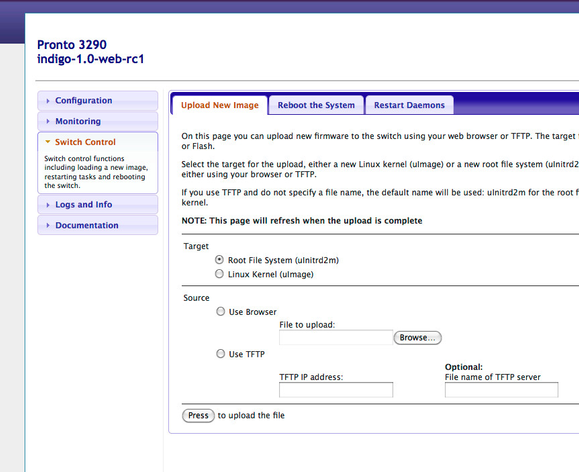
When an image is uploaded, the MD5 sum will be displayed to allow verification that the proper image file has been loaded without corruption.|
Logs and Info
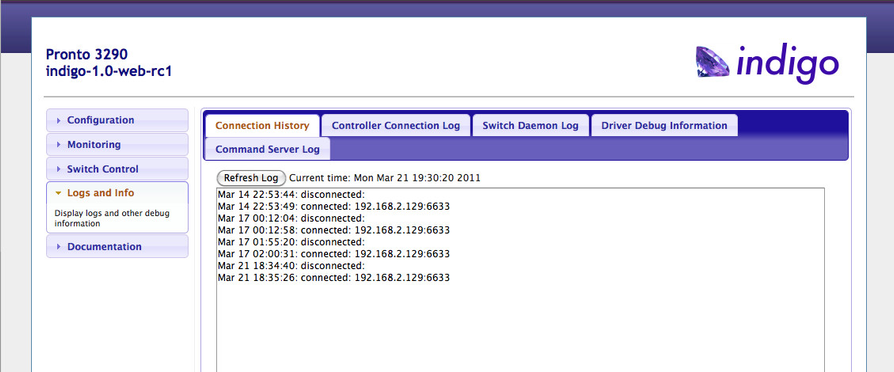
The logs page includes a number of tabs.
- Connection History: This useful tab shows a summary of connection and disconnection messages with the controller. The last message indicates the current connection status.
- Controller Connection Log: This shows the full output of the VLOG daemon between the ofprotocol, ofdatapath and the controller.
- Switch Daemon Log: This shows the output of log messages from the low level switch driver, ofswd, which includes messages from ofdatapath.
- Driver Debug Information: This is a status page showing various internal error and status counters.
- Command Server Log: This shows messages generated by the command server module from inside ofswd. It can be useful in debugging protocol related issues with components communicating with the command server.
Documentation
The documentation page includes links to further information about OpenFlow and Indigo.